
Most appreciated and most depreciated cities between 2021 and 2025
Welcome to the latest update on the U.S. housing market, where we’ll dive into what’s really happening and share actionable tips for home buyers and sellers in fall 2025. I’m @ShawnTheRealtorGuy from Portland, Oregon, and this is your go-to guide for the next couple of months. No need to binge-watch other real estate updates—stick with me as we zoom out to understand the bigger picture, using data-driven insights and a focus on key markets like Austin, Texas, and Portland, Oregon. Let’s break it down.
The Big Picture: A Five-Year Perspective
To truly understand the housing market, you need to look beyond year-over-year data. The real story unfolds over the past five years, revealing peaks, valleys, and long-term trends. My go-to metric for assessing market health is Median Sale Price Per Square foot (MSPPS), as it minimizes distortions from outliers (like a $10 million home in a small town) and provides a clear view of value trends. Let’s explore what’s happening in key cities, with a deep dive into Austin, Texas, and Portland, Oregon, and then offer practical advice for fall 2025.
Austin, Texas: A Rollercoaster Ride

Austin’s housing market has been a wild ride, but zooming out reveals a more stable story:
- 2020: Median sale price per square foot was $186.
- 2021: Jumped 34% to $249.
- May 2022: Peaked at $292, a 23% increase from 2021, totaling a 57% surge in just two and a half years.
- July 2025: Dropped 25% from the peak to $220 per square foot.
Despite the recent decline, Austin’s market has still appreciated 18% from 2020 to 2025, averaging 4% annual growth. However, if you bought at the 2022 peak ($292/sq ft), selling now means a loss of $72 per square foot—that’s $72,000 for a 1,000-square-foot home. Ouch.
The Catch: Austin may not have hit bottom yet. Prices could dip closer to $200 per square foot, meaning those who bought at the peak might need to wait 7–10 years to break even (assuming 4% annual appreciation after the bottom). If you’re in Austin and bought high, hold tight unless you’re prepared for a loss.
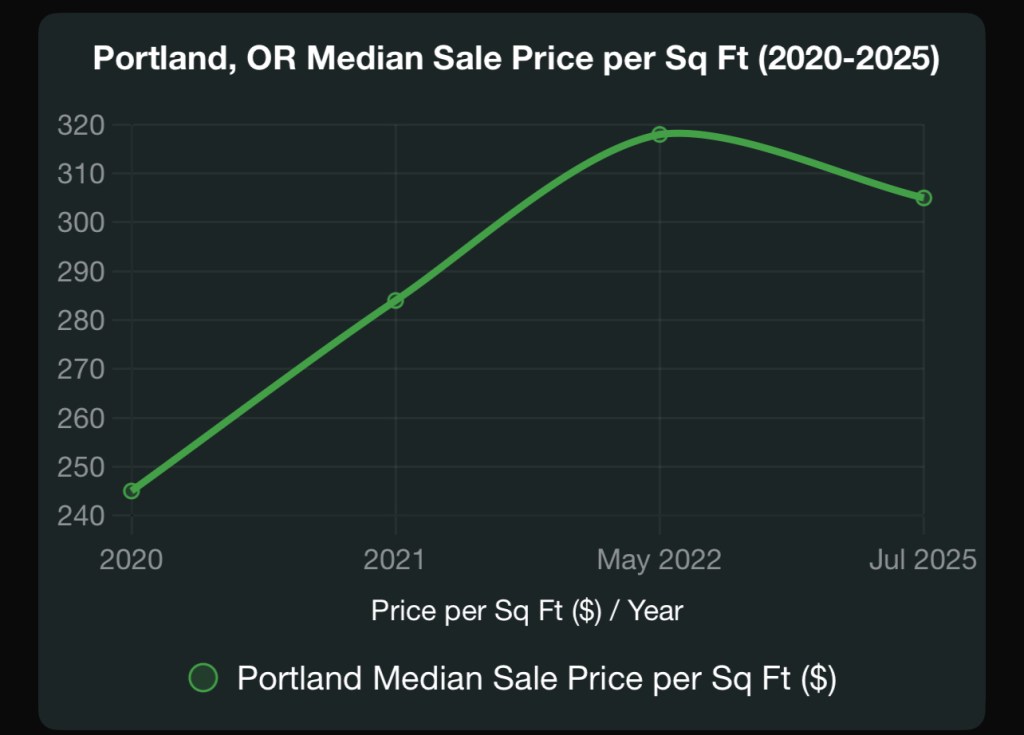
Portland, Oregon: Steady Growth
My home market of Portland, Oregon, tells a different story:
- 2020: Median sale price per square foot was $245.
- 2021: Rose 16% to $284.
- May 2022: Climbed another 12% to $318.
- July 2025: Dipped 4% from the peak to $305.
Over five years, Portland has seen 25% appreciation, averaging 5% annually. While not as volatile as Austin, Portland’s market has cooled slightly but remains relatively strong.
Other Cities: A Mixed Bag
Across 10 major U.S. cities, including Los Angeles, Miami, Chicago, Denver, Phoenix, Cincinnati, Houston, and Seattle, annual appreciation from 2020 to 2025 ranges from 4% to 11%. Here’s a snapshot:
- Los Angeles: Only depreciated 1% from its May 2022 peak ($569/sq ft) to July 2025 ($565/sq ft), with steady growth from $474 in 2020 (6% annual appreciation).
- Miami: A standout with 11% annual appreciation, totaling 54% from 2020 to 2025.
- Other Markets: Cities like Denver, Phoenix, and Cincinnati show 5–9% annual growth, reflecting diverse market dynamics.
The key takeaway? No major market has seen overall depreciation over five years which is important to remember, but recent buyers in high-peak markets like Austin face challenges.
The Housing Market Narrative: Busting the Crash Myth
Turn on the news, and you’ll hear headlines screaming, “The housing market is crashing!” or “Sellers outnumber buyers!” While markets like Austin have seen significant declines from their 2022 peaks, the broader picture isn’t so dire. Most cities are still appreciating when viewed over five years, and markets like Miami and Los Angeles remain robust. The “crash” narrative often overstates short-term dips while ignoring long-term gains.
However, if you bought at the peak in markets like Austin, you could be underwater—owing more than your home’s current value—if you sell now. This could mean a short sale unless you can cover the difference. For most homeowners, holding for 7–10 years could help recover losses, assuming prices stabilize or rebound.
Fall 2025: A Pivotal Moment for Buyers and Sellers
Here’s why fall 2025 could be a game-changer, along with tailored tips for buyers and sellers.
Why Fall 2025 Matters
For the first time in four years, I’m predicting a mortgage rate drop in September 2025. The Federal Reserve’s hands are tied: inflation and job numbers are weak, forcing a likely reduction in the federal funds rate. This will indirectly lower mortgage rates, which are currently around 6.3% for a 30-year fixed loan. My guess? Rates could dip to 6% by fall’s end.
With rents rising, home prices slightly declining in some markets, and rates poised to drop, fall 2025 may be the best time to buy in the next three years. Waiting could mean higher prices, as home values are outpacing income and savings growth, driven partly by inflation. For example, gas prices and home prices often rise together, reflecting broader economic trends.
Tips for Home Buyers
- Act Now: Fall 2025 offers a unique window to negotiate with sellers on price and terms, especially in buyer-favored markets like Austin, where inventory is high (17,609 active listings, up 14.7% year-over-year in August 2025).
- Affordability: Ensure you can afford a home at current rates (~6.3%). Don’t bank on refinancing later, as rate drops aren’t guaranteed.
- Target Deals: Look for homes with price drops (59% of Austin listings in August 2025) or those sitting on the market longer (median 60–87 days in Austin).
Tips for Home Sellers
- Hold Off If Possible: If you don’t need to sell in 2025, wait until spring or summer 2026. Prices are likely to rise 4–8% in most markets by then, based on historical trends.
- Make Your Listing Stand Out: If you must sell now, price competitively to attract buyers. In Austin, homes are selling 3% below list price (97% sale-to-list ratio in June 2025). Stage your home, highlight value, and be flexible on terms.
- Avoid Short Sales: If you bought at the 2022 peak, check your home’s current value. Selling now could mean a loss, so consult a realtor to explore options.
Visualizing the Trends
To illustrate Austin market, here’s a chart showing the median sale price per square foot from 2020 to 2025:

This chart highlights Austin’s 57% surge from 2020 to 2022, followed by a 25% drop by July 2025, resulting in an 18% net gain over five years.
For Portland, here’s the trend:
Portland’s steadier 25% growth over five years shows a more resilient market.
Final Thoughts
The U.S. housing market in fall 2025 is a tale of diversity: Austin’s facing a tough correction, Portland’s holding steady, and markets like Miami are thriving. By zooming out to a five-year view, we see that most markets are still appreciating at 4–11% annually, despite short-term dips. For buyers, now’s the time to negotiate and lock in a home before prices and rates climb. For sellers, patience until 2026 could maximize returns, unless you can make your listing a standout deal.
Thanks for reading, and here’s to making smart moves in the housing market!
Data sourced from Redfin and industry reports
Discover more from Shawn Realty - Portland Real Estate
Subscribe to get the latest posts sent to your email.
