

By Shawn Yu
Shawn Realty | Portland Metro
Probably the worst fear for homeowners and home buyers is losing the house to foreclosure. Right now YouTube and the rest of the internet are full of the same message: foreclosures are exploding, 2008 is already here, things are about to get much worse with house burning thumbnail images to attract your attention.
I wanted to look at what is actually happening in the Portland metro market and nationally — how many foreclosure filings we are seeing now, how the numbers moved from 2002 through 2026, why 2008 happened, and what would have to break for another wave later this decade.
Important first: a foreclosure filing is not a completed foreclosure. Two million filings does not mean two million homes become bank-owned.
Look at the base year, not just the percentage
Doom-and-gloom videos love to say filings are up 200% or 500%. The question is always: compared to what?
If they start from 2022, when filings were extremely low (often under 1,000), almost any increase looks huge. If they compared today with 2009–2010, we would be in real trouble. We are not.
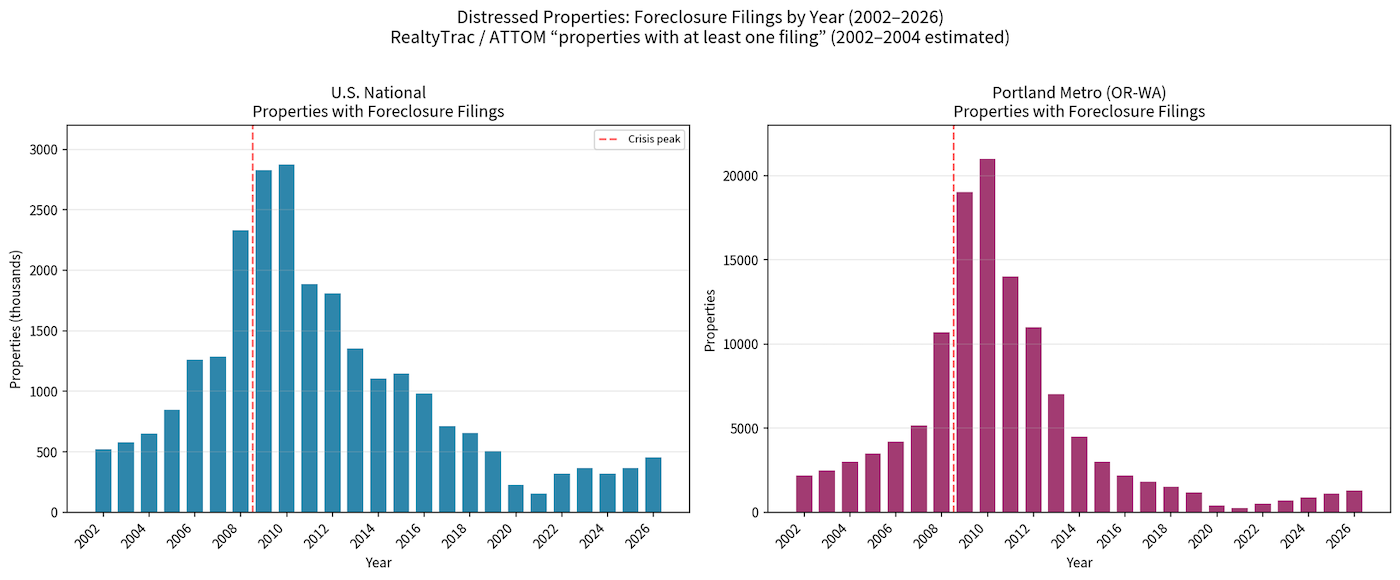
At the peak around 2010:
- Portland Metro: about 21,000–25,000 filings
- Nationwide: about 2.8 million properties received filings
In 2026, nationwide filings are still below 500k. Compared with 2006, current filings are about one-third. Twenty years ago (before the market crash), the filing count was roughly three times higher than now.
When you watch a lot of social media, everything sounds catastrophic. My simpler check: try to find a parking spot at Costco on a Sunday afternoon. That is closer to real economic data than a lot of the videos.
Portland metro right now: the actual inventory
- Bank-owned (REO) listings: about 11 active, 2 pending
- Last month: about 5 REO sales
- Short sales (owner owes more than the home is worth): about 12 active
Those are very small numbers.
Most of these properties sit in the first-time-buyer range in Portland — under $500,000. There is also a $4.2 million short sale in Lake Oswego. Foreclosure risk is not only a lower-income problem. Overpaying can put higher-priced homes in trouble too.
Filings vs. completed REOs
One property can generate three different filings:
- Notice of default (you missed a payment)
- Auction notice
- Bank repossession / REO notice
In 2010 there were about 2.87 million filings nationwide. Completed foreclosures were closer to 1 million — about one-third. In 2011 it was about 1.9 million filings and 1.07 million completed. Early in the crisis many loans had been sold and resold so many times that lenders lost track and could not finish the process.
Today the conversion rate is even lower — closer to one completed foreclosure for every eight filings.
For Portland Metro in 2010, 21,000 filings likely meant something like 6,000–8,000 homes actually completed the bank-takeover process.
The number to watch is when filings start approaching 2006 levels. We are not there.
Why 2008 happened — and what is different now
The usual story is subprime loans plus adjustable-rate mortgages. Banks lended to people who did not really qualify. When variable mortgage rates reset, payments doubled or tripled. People who barely made the first payment could not make the new one.
The stock-market crash also wiped out savings and retirement accounts. I have a friend who lost his entire retirement and had to go back to work.
Something people talk about less: medical bills. High medical costs were a major driver of foreclosure. Some estimates put medical issues behind 50–60% of cases at the time.
Medical costs are still a problem. Subprime lending is not the same. There is more regulation and much stricter income verification. We do not have that same volume of risky loans.
What we do have is the 2021 “date the rate, marry the house” buyers. I never used that line then. I still think it is cringe. A lot of those buyers stretched at peak prices and assumed rates would be back near 4% by now. In new Hillsboro subdivisions I regularly see owners losing $1,000–$2,000 a month even if they rent the house out. The rental market does not support 2021 purchase prices plus today’s payment. Those owners are the most visible stress points.
Properties with at least one foreclosure filing, 2002–2026
(RealtyTrac / ATTOM definition. National figures in thousands. Portland = Portland-Vancouver-Beaverton / Hillsboro MSA.)
| Year | U.S. National | Portland Metro | Notes |
|---|---|---|---|
| 2002 | 520,000 | 2,200 | Estimated |
| 2003 | 580,000 | 2,500 | Estimated |
| 2004 | 650,000 | 3,000 | Estimated |
| 2005 | 847,000 | 3,500 | National: RealtyTrac; Portland estimated |
| 2006 | 1,259,000 | 4,200 | National: RealtyTrac; Portland estimated |
| 2007 | 1,286,000 | 5,162 | Portland: RealtyTrac MSA report |
| 2008 | 2,330,000 | 10,684 | Portland: RealtyTrac MSA report |
| 2009 | 2,825,000 | 19,000 | Portland estimated |
| 2010 | 2,871,000 | 21,000 | Portland from contemporaneous reports |
| 2011 | 1,888,000 | 14,000 | Portland from contemporaneous reports |
| 2012 | 1,807,000 | 11,000 | Portland estimated |
| 2013 | 1,352,000 | 7,000 | Portland estimated |
| 2014 | 1,105,000 | 4,500 | Portland estimated |
| 2015 | 1,148,000 | 3,000 | Portland estimated |
| 2016 | 980,000 | 2,200 | Portland estimated |
| 2017 | 714,000 | 1,800 | Portland estimated |
| 2018 | 658,000 | 1,500 | Portland estimated |
| 2019 | 504,000 | 1,200 | Portland estimated |
| 2020 | 224,000 | 400 | Pandemic moratoria |
| 2021 | 154,000 | 250 | Historic low |
| 2022 | 322,000 | 500 | Portland estimated |
| 2023 | 364,000 | 700 | Portland estimated |
| 2024 | 322,000 | 900 | Portland estimated |
| 2025 | 367,000 | 1,100 | Portland estimated from county ATTOM data |
| 2026 | 455,000 | 1,300 | Annualized estimate from H1 data |
Sources and caveats
- National 2005–2025: RealtyTrac / ATTOM year-end “properties with at least one filing.”
- 2002–2004 national: scaled from MBA foreclosure-inventory and start rates (no RealtyTrac property counts existed yet).
- Portland 2007, 2008, 2010, 2011: published RealtyTrac metro figures. All other Portland years are estimates based on Oregon statewide trends, county ATTOM snippets, and the national cycle.
- 2026: first-half 2026 national (227,548) annualized; Portland scaled from rising county activity.
The table matches the bars in the 2002–2026 chart.
Filings vs. completed foreclosures (REOs)
A “property with at least one filing” is any home that got a default notice, auction notice, or a bank takeover that year.
A completed foreclosure / REO is only the last step: the lender actually took title.
Most filings never become REOs. Owners catch up, get a modification, sell short, or the case is dropped.
National — rough comparison
| Year | Properties with ≥1 filing | Completed REOs (bank took title) | REO as % of filings |
|---|---|---|---|
| 2007 | 1.29 million | ~400–500k (est.) | ~35% |
| 2008 | 2.33 million | ~800–900k (est.) | ~35–40% |
| 2009 | 2.82 million | 884,000 | 31% |
| 2010 | 2.87 million | 1,050,500 | 37% |
| 2011 | 1.89 million | ~1.07 million | ~57%* |
| 2012 | 1.84 million | ~670,000 | 36% |
| 2013 | 1.36 million | 463,000 | 34% |
| 2019 | 504,000 | 144,000 | 29% |
| 2024 | 322,000 | ~37,000 | 11% |
| 2025 | 367,000 | 46,400 | 13% |
| 2026 (est.) | ~455,000 | ~56,000 | ~12% |
*2011 REO stayed high while new filings fell — backlog from 2009–10 working through the system.
Rule of thumb nationally
- Crisis peak (2009–11): about 1 in 3 properties that got a filing ended the year (or the next) as a bank-owned home.
- Today: about 1 in 8.
RealtyTrac once summed 2006–2013 as 10.9 million starts and 5.6 million repossessions — roughly half of starts eventually completed over that whole cycle.
Portland metro — rough estimate
Published REO counts for the MSA are scarce. Best anchors:
- HUD / RealtyTrac: ~25,200 completed foreclosures in the Portland MSA from April 2009 through May 2013 (~6,000 per year on average).
- Peak filing years 2009–10 were 19,000–21,000 properties. Applying the national 30–40% completion rate gives **6,000–8,000 completed REOs** in the worst year.
- 2008 filings were 10,684; completed that year or lagging into 2009 were probably ~3,000–4,500.
- 2025–26: filings estimated ~1,100–1,300. At today’s ~12% completion rate, roughly 130–200 actual bank takeovers per year in the metro — a tiny fraction of the crisis.
Bottom line
| Period | National filings | National completed | Portland filings | Portland completed (rough) |
|---|---|---|---|---|
| 2008 | 2.3 million | ~0.8–0.9 million | 10,700 | ~3,000–4,500 |
| 2010 peak | 2.9 million | 1.05 million | ~21,000 | ~6,000–8,000 |
| 2025 | 367,000 | 46,000 | ~1,100 | ~150–200 |
So “available distressed inventory” in the old chart is the filing count. Homes that actually went to the bank were typically one-third in the crash and about one-eighth now. Portland followed the same pattern at a smaller scale.
What could cause a later crash?
A stock crash because earnings do not match prices? Possible anytime. I do not have a useful forecast on that.
AI taking jobs? Entry-level programmers are having a hard time, and hiring is frozen in a lot of industries. My read is that this is still more a weaker economy and cautious spending than mass AI replacement. I have not seen realtors, loan officers, or lawyers being replaced at scale. Graphic designers are more exposed. Plumbers and drivers? Not in any volume I can see yet.
Population decline from immigration policy? The United States is still an attractive place to live. I do not have data that this becomes a housing-crash driver.
Right now war, oil prices, Fed rates, and mortgage rates have the market locked up. If that continues for years, strain will grow. Looking at how fast filings rose from 2002 into 2007–2010, if a sharper wave comes, the previous curve points more toward 2030–2031 than 2026–2027. That is just connecting the last cycle’s dots — not a prediction. The assumptions behind a near-term crash still look pretty weak.
Why prices may not crash the way people expect
Inflation works the other way. When money loses value, hard-to-replace assets — land plus a house — tend to hold or rise in price. A pen is easy to replace. A house is not.
People who bought at the 2007 peak and simply held often saw the property double or triple in many cities. That equity gives owners room to ride out a rough stretch. Rising equity alone can prevent a lot of filings turning into completed foreclosures. Many homeowners have enough equity in their homes as well in 2026 due to the rapid home price appreciation we experienced in 2020-21.
That is one of the main reasons I do not treat a 2008-style crash as the base case right now.
I will update this chart from time to time. Once filings get close to 2006 levels, the conversation changes. Right now they are about one-third of that. That is the takeaway.
If you’d like more detail data of the Portland Metro market, call or text me at 503-515-4499.
Shawn Yu
Principal Broker, Shawn Realty
www.shawn-realty.com
Discover more from Shawn Yu Realtor
Subscribe to get the latest posts sent to your email.